Index Curve and CT value meaning for q-PCR
In the previous article, we mentioned that qPCR is actually an exponential replication after recognizing a specific DNA, for details, see the previous article, “Introduction to the principle of qPCR detection: amplification principle”. In this article, we will extend the exponential replication, and we will talk about how the amplification curve presented by qPCR results is formed and what the ct value.
Principle of amplification curve formation
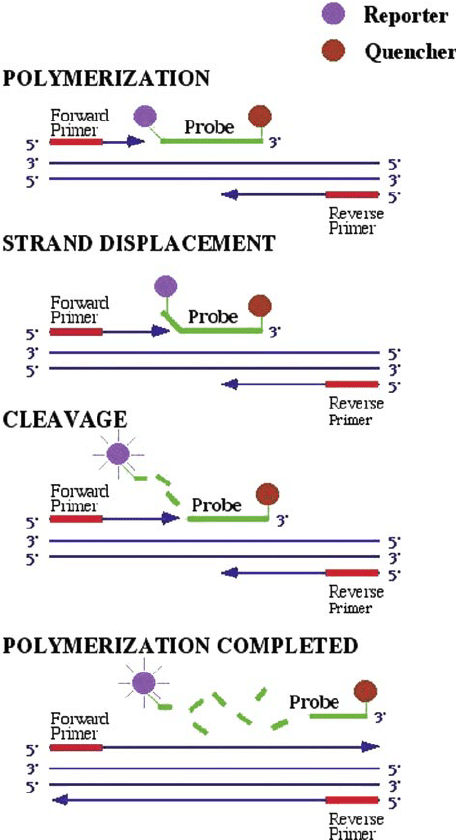
We believe that in fact the intensity of the fluorescence signal and the concentration of nucleic acid are in one-to-one correspondence, the principle of which is shown in Figure 1.

One unit of fluorescent signal is released for each new DNA strand formed, so for ease of understanding, below we fluorescent signal is equivalent to the number of nucleic acids.
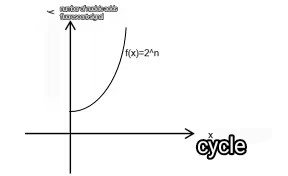
Nucleic acid amplification, from the model, nucleic acid 1 into 2,2 into 4, which is consistent with the mathematical exponential power equation f(x)=2^n, where n is the number of replications, qPCR replications once that is a cyclic reaction, so we will call n as the number of cycles. Assuming that the initial nucleic acid has S, then the number of nucleic acids after amplification should be f(x)=S*2n, but in the actual amplification because of a variety of factors, in fact, can not reach 100% amplification, that is, the amplification efficiency of less than 100%, so we will be in the design of reagents through the test of nucleic acid amplification of the amplification efficiency, here we use E to indicate. Because of the existence of E, we can’t realize the exponential amplification of 2 every time, it should be converted to the exponential amplification of (1+E).
Therefore the actual amplification curve equation is f(x)=S*(1+E)n。Its corresponding mathematical model is shown in Fig. 2 and Fig. 3. Where the x-coordinate is the number of cycles (time) and the y-coordinate can be interpreted as the number of nucleic acids.

Fig 2:f(x)=2n

Fig 3:f(x)=S*(1+E)n
In the actual amplification, although the amplification is already started from the first time, but because the concentration is too low in the early stage, the equipment can not be detected, so from the equipment, it is the reaction lasts for a certain period of time before our amplification curve begins to be detected, and has been maintaining an exponential amplification in the “upward” trend, which is what we call the This is what we call the exponential growth period. The undetected portion of the curve, which appears as a straight line on the device, is called the baseline period, as shown in Figure 4.

Fig 4:The baseline period

Fig5:steady-state phase (Feedstock depletion,end of reaction.)
In the mathematical model of f(x)=S*(1+E)n, f(x) can reach infinity, but the maximum amount of nucleic acid that can be reached in the qPCR reaction system is actually limited, the reaction feedstock inside can support the exponential amplification is also limited, so in the late stage of the reaction, because of the gradual exhaustion of feedstock, the reaction will slowly slow down until it completely stops, and the value of the vertical coordinate of the reflection will become the growth slowdown until it completely flat, this is what we call the steady-state phase, as shown in Figure 5, the dotted line is the curve of the mathematical model, and the red line is the actual reaction system of the raw material is slowly depleted and gradually enter the steady-state phase.
To summarize, a complete amplification curve should have an early baseline period, an exponential growth period, and a later steady-state phase, as shown in Figure 6.

Fig6:amplification curve
The complete amplification curve is called the standard “S-curve” in qPCR, and the first requirement to be met for the interpretation of positive results is that the amplification curve must be a standard “S-curve”,as shown in Figure 7.

Fig7: ”S-curve”
Note: The fluorescence threshold is usually set automatically to 10 times the standard deviation of the baseline fluorescence value, or it can be set manually. It is used to determine the ct as the background fluorescence intensity over the baseline period, which can be interpreted as the amount of amplification product that reaches a “certain level”.
Why do we need CT values?
As we mentioned above, the relationship between the amount of product and the number of cycles during PCR exponential amplification is: Amount of amplified product f(x) = Amount of starting template S x (1+E)^ Number of cycles n.
Setting of Ct value: During the amplification process, a fluorescence signal value is set, and when the amount of amplified product reaches a “certain amount of product” (when this fluorescence threshold is reached), the number of cycles at this time is defined as the Ct value, as shown in Figure 8. It should be noted that the Ct value needs to be in the period of exponential amplification.

Defining f(x) as just reaching the detection limit, the threshold value: ct is the number of cycles, the formula becomes f(x)=S*(1+E)ct, and we can see from the formula that f(x), (1+E) is constant, and the larger S is, the smaller Ct is, and vice versa the larger Ct is.Therefore the relationship between Ct value and starting template amount: the higher the concentration of starting template amount, the smaller the Ct value; the lower the concentration of starting template amount, the larger the Ct value.
Ct value is the most important form of presenting the results of fluorescence qPCR, and the ct value can be used to calculate the relative or absolute amount of genes. In general, the difference of Ct value of repeated experiments should preferably not exceed 0.05, otherwise it indicates that the error result is too large and the result is not credible. In the early stage of qPCR, the amplification is in an ideal situation, the number of cycles is small, the accumulation of products is small, the tiny error that produces fluorescence has not yet been amplified.The reproducibility of the Ct value is excellent, the same template is amplified at different times or amplified in different tubes at the same time, and the Ct value obtained is constant.
The Ct value is the most important indicator for determining the presence of the target gene in the sample, and the magnitude of the ct value is also a criterion for initially determining the nucleic acid concentration of the initial sample.
Conclusion
Today, we learned the basic principles of qPCR .In order to facilitate the understanding, I have actually simplified a lot of concepts here.If you want to learn more, you can also leave a message below, I see will be promptly arranged. Next, I will focus on a number of reasons affecting the qPCR results with you to explore learning, please look forward to.
